Personal Finance Analyser
How did this happen?!
Ever wondered why your bank account is empty at the end of month? Or have you ever stood at the coffee bar in your office, thinking: “How much do I actually spend here?”
If you want answers, read on! If not: Enjoy the coffee ;)
What do we need?
In order to follow along, you will need:
- A bank account at ING or ABN AMRO
- Running Splunk instance
Running a Splunk instance is easy if you have Docker. Simply run
docker run -d -p 8000:8000 -e "SPLUNK_START_ARGS=--accept-license" -e "SPLUNK_PASSWORD=<password>" --name splunk splunk/splunk:latest
And after a minute or two, you can access your Splunk instance in a web browser at http://127.0.0.1:8000/
If you have a Rabobank account and can share the column structure of their CSV export, send a copy so that I can create a macro for that data as well!
Prep work
Getting the data
From both the ING or ABN AMRO website, you can export transactions that occurred in your bank account. Make an export to a CSV file with the preferred date range you would like to get insights on and save it to your local computer.
Load it into Splunk
Go to your Splunk instance and login. Then use the “Add data” button on the welcome page to upload your CSV transactions file.
Normalization macro
Now you have the data loaded in, it is time to create the macro you can use to analyze your data in a proper format. You create a macro in Splunk under settings -> advanced search -> macros.
For ING, the macro to parse the exported CSV is:
source="*.csv"
| rename "Bedrag _EUR" as amount "Naam _ Omschrijving" as description "Af Bij" as direction Code as code
| eval amount=replace(amount, ",", ".")
| convert num(price)
This creates the following fields to use:
Amount: The euros in the transaction
Code: The transaction type
Description: The details of the transaction
Direction: Contains two values, if money is deducted or added
For ABN AMRO, the macro is:
source="*.csv"
| rename Beginsaldo as "starting_saldi", Eindsaldo as "after_saldi", Omschrijving as "description", Transactiebedrag as "amount"
| eval amount=abs(amount), description=mvindex(split(description," "),2)
This creates the following fields to use:
Amount: The euros in the transaction
Description: The details of the transaction
Direction: Contains two values, money deducted or added
starting_saldi: cash total before the transaction
after_saldi: Cash total after the transaction
Time to search!
Now we are at the point where we can get some insights in where our money is going to. In the examples, mock ING data will be used with random generated events.
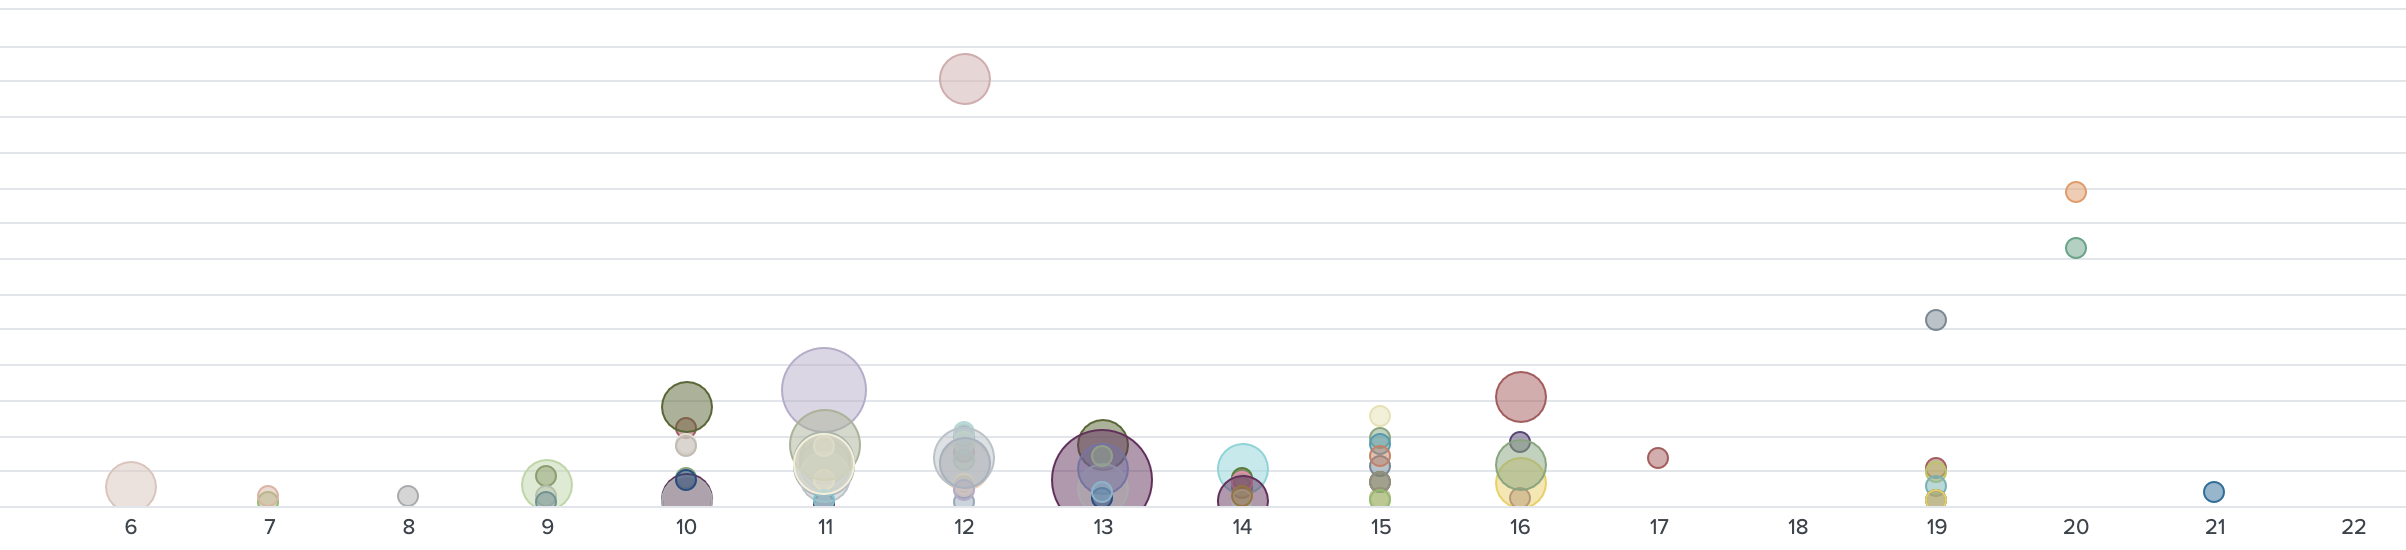
Let’s start with checking out at what store during a particular hour your money goes to. Run the following query. The data is best visualized with a bubble chart.
`ing_macro`
| search code="ba" amount < 300
| eval timestamp=mvindex(split(Mededelingen," "),2)+ " " + mvindex(split(Mededelingen," "),3)
| eval ts_epoch = strptime(timestamp, "%d-%m-%Y %H:%M")
| eval date_hour = strftime(ts_epoch,"%H")
| eval _time=ts_epoch
| stats sum(amount) as spending c as transactions by description, date_hour
| sort - store date_hour
| table description date_hour spending transactions
This will result in a graph looking like below. The X-Axis is the hour, Y-Axis shows spendings and the bubble is sized based on the count of transactions.
Okay, so that helps in drawing some conclusions probably. But what about those sneaky monthly subscriptions? These can be identified with the payment code ic in the exported data. With the following query these can be identified:
`ing_macro`
| search code="ic"
| stats avg(amount) as spend c by description
| eval spend=round(spend,2)
| where c > 1
| fields - c
This will drop you a table of all the monthly subscriptions running during the exported timeframe.
Finally, let’s take a look at the stores where we are doing a high number of small transactions, let’s say less than 50 bucks per transaction and more than 3 transactions in the timespan (1 month or so).
`ing_macro`
| search code="ba"
| stats sum(amount) as spendings c as transactions earliest(_time) as earliest latest(_time) as latest by description
| convert timeformat="%d-%m-%Y" ctime(earliest), ctime(latest)
| eval avg_spending_per_transaction = round(spendings/transactions,2)
| sort - spendings
| where transactions > 3
| table earliest latest description spendings transactions avg_spending_per_transaction
This will result in a table overview with:
- First time a transaction was made here
- Last time a transaction was made here
- The store (extracted from the description)
- How much you spend here in total
- The number of transactions
- The average spending per transaction
With these examples, you hopefully will be able to get clarity on some of your spendings. Happy splunking!
Conclusion
After exporting, loading and normalize data your payment transactions will have no more secrets! Go through the data and identify your biggest financial leaks, monthly subscriptions or most popular stores.